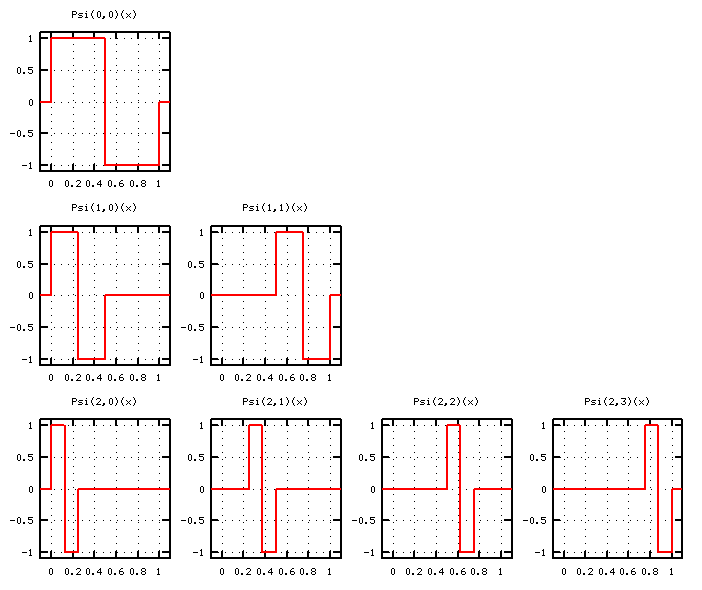
Tinha isto aqui guardado (Haar wavelet).

A função "mãe":
function retval=mf(x)
  n=length(x);
 for i=1:n;
    if (x(i)<=0 | x(i)>1)
      retval(i)=0;
    else
      if (x(i)<=1 && x(i)>.5)
        retval(i)=-1;
      else
      endif;
      if (0<= x(i) && x(i) <=.5)
        retval(i)=1;
      else
      endif;
    endif;
  endfor;
endfunction
Para desenhar os gráficos:
x=[-.1:.001:1.1];
k=0;
for i=0:2
  for j=0:2^i-1
    k=k+1
    subplot(3,4,j+4*i+1)

    plot(x,mf(2^(i)*x-j),'r-','linewidth',2)
    grid
    axis([-.1 1.1 -1.1 1.1])
    title(sprintf('Psi(%i,%i)(x)',i,j))

    xlabel('x')
  endfor;
endfor;
Created: NaN
Last updated: 23-01-2025 [00:04]
For attribution, please cite this page as:
Charters, T., "Haar wavelet": https://nexp.pt/haar.html (23-01-2025 [00:04])
(cc-by-sa) Tiago Charters - tiagocharters@nexp.pt